
 Statistics released by the Canadian Real Estate Association (CREA) show national home sales and new listings continued to rebound in July 2020, with new listings hitting their highest level on record for the month of July, while sales posted the highest level of any month in history.
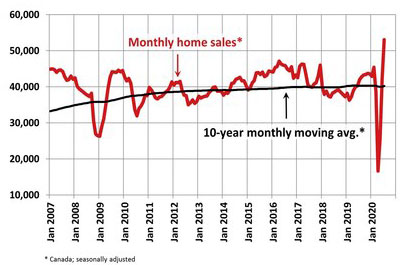
Home sales recorded over Canadian MLS® Systems rebounded by a further 26% in July 2020, raising them to the highest monthly level ever recorded.
Among Canada's largest markets, sales rose by 49.5% in the Greater Toronto Area (GTA), 43.9% in Greater Vancouver, 39.1% in Montreal, 36.6% in the Fraser Valley, 31.8% in Hamilton-Burlington, 28.7% in Ottawa, 16.9% in London and St. Thomas, 15.7% in Calgary, 12.1% in Winnipeg, 9.7% in Edmonton and 5.4% in Quebec City.
The 62,355 transactions recorded in July 2020 marked the highest monthly sales figure on record going back more than 40 years.
"With more and more of regular everyday life opening back up, REALTORS® and their clients across Canada are making up for lost time, and it's been a very busy summer as a result," said Costa Poulopoulos, chair of CREA.
"With sellers and buyers returning to the market in record numbers as lockdowns are increasingly lifted, we continue to make sure clients stay safe by complying with government and health officials' directives and advice, while continuing to use virtual technology to show properties and complete required forms and contracts.
"What a difference three months makes, from some of the lowest housing numbers ever back in April to the multiple monthly records logged in July," said Shaun Cathcart, CREA's senior economist.
"A big part of what we're seeing right now is the snap back in activity that would have otherwise happened earlier this year. Recall that before the lockdowns, we were heading into the tightest spring market in almost 20 years. Things may have gone quiet for a few months, but ultimately the market we're seeing right now is mostly the same one we were heading into back in March. That said, there are some new factors at play as well. There are listings that will come to the market because of COVID-19, but many properties are also not being listed right now due to the virus, as evidenced by inventories that are currently at a 16-year low. Some purchases will no doubt be delayed, but the new-found importance of home, lack of a daily commute for many, a desire for more outdoor and personal space, room for a home office, etc. will certainly also spur activity that otherwise would not have happened in a non-COVID-19 world."
The number of newly listed homes climbed by another 7.6% in July compared to June. New supply was only up in about 60% of local markets, as the rebound in supply appears to be tapering off in many parts of the country. The national increase in July was dominated by gains in the GTA.
With the ongoing rebound in sales activity now far outpacing the recovery in new supply, the national sales-to-new listings ratio tightened to 73.9% in July compared to 63.1% posted in June. It was one of the highest levels on record for this measure, behind just a few months back in late 2001 and early 2002.
Based on a comparison of sales-to-new listings ratios with long-term averages, only about a third of all local markets were in balanced market territory, measured as being within one standard deviation of their long-term average, in July 2020. The other two-thirds of markets were all above long-term norms, in many cases well above.
The number of months of inventory is another important measure of the balance between sales and the supply of listings. It represents how long it would take to liquidate current inventories at the current rate of sales activity.
There were just 2.8 months of inventory on a national basis at the end of July 2020 – the lowest reading on record for this measure. At the local market level, a number of Ontario markets shifted from months of inventory to weeks of inventory in July.
The Aggregate Composite MLS Home Price Index (MLS® HPI) jumped by 2.3% in July 2020 – the second largest increase on record (after March 2017) going back 15 years.
Of the 20 markets currently tracked by the index, every one posted a m-o-m increase in July.
The biggest m-o-m gains, in the range of 3%, were recorded in the GTA, Guelph, Ottawa and Montreal; although, generally speaking most markets east of Saskatchewan are seeing prices accelerate in line with strong sales numbers. Price gains were more modestly positive in B.C. and Alberta.
The non-seasonally adjusted Aggregate Composite MLS® HPI was up 7.4% on a y-o-y basis in July – the biggest gain since late 2017.
The MLS HPI provides the best way to gauge price trends because averages are strongly distorted by changes in the mix of sales activity from one month to the next.
The actual (not seasonally adjusted) national average price for homes sold in July 2020 was a record $571,500, up 14.3% from the same month last year.
The national average price is heavily influenced by sales in the Greater Vancouver and the GTA, two of Canada's most active and expensive housing markets. Excluding these two markets from calculations cuts around $117,000 from the national average price. The extent to which sales continue to fluctuate in these two markets relative to others could have further compositional effects on the national average price, both up and down.